Understanding Flow Performance
Want to know how your flows are performing? The Analytics tab gives you a clear picture of user engagement and flow effectiveness.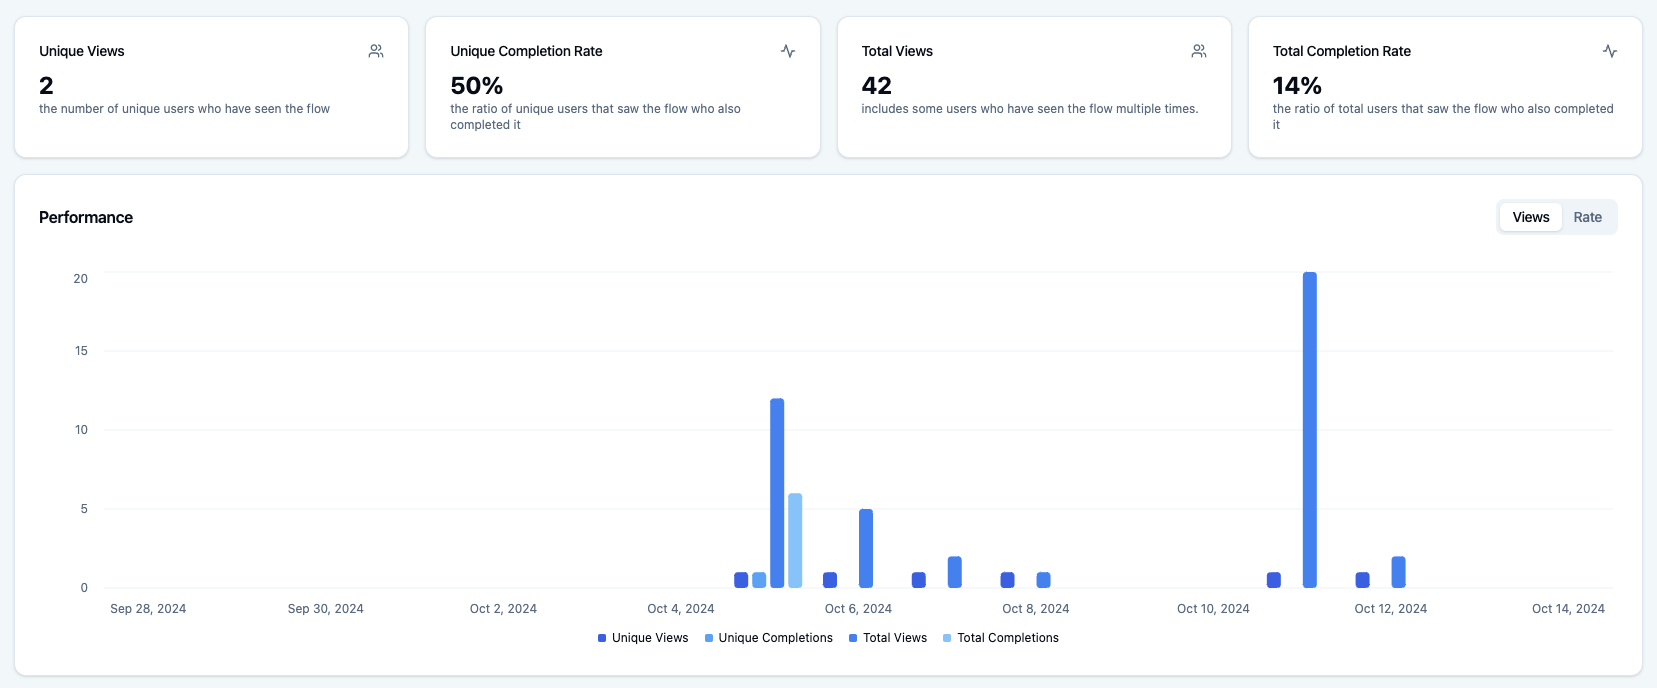
Key Metrics
- Unique Views: How many different users have seen your flow
- Total Views: The total number of times your flow has been viewed (including repeat views)
- Completion Rate: The percentage of users who finish the entire flow
Step-by-Step Analysis
The Step Funnel shows you exactly where users might be dropping off or getting stuck: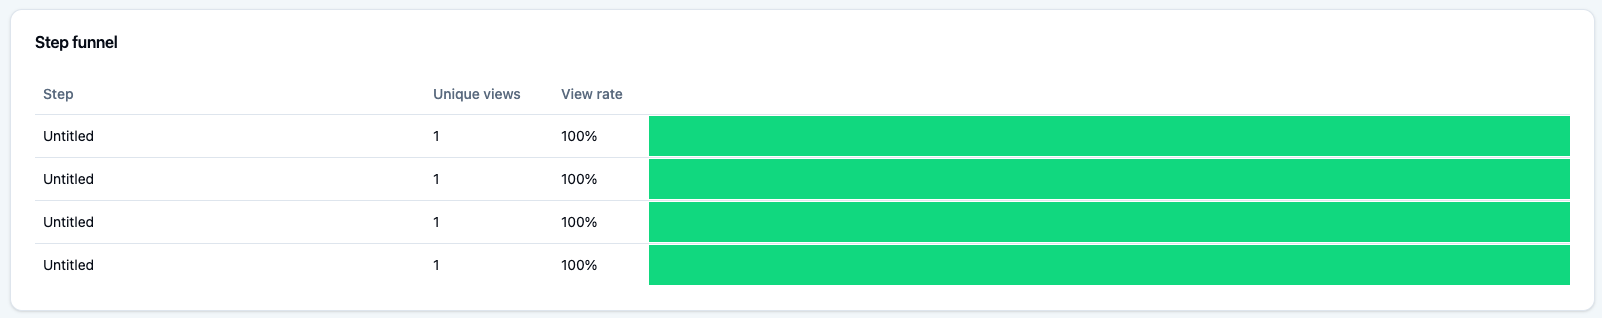
What to Look For
- Unique Views: How many users reached each step
- View Rate: The percentage of users who saw each step
- Funnel Shape:
- A perfect funnel (wider at top, narrower at bottom) means users are progressing naturally
- Sudden drops indicate potential issues
- Branching flows may show different patterns
Improving Your Flow
If you notice a steep drop after a particular step:- Review the step’s content
- Check for technical issues
- Consider simplifying the flow
- Make the content more engaging
Note: For flows with branching paths or skippable steps, the funnel might not look traditional, as some users might skip ahead or take different paths.
Recent User Sessions
Every time a user starts your flow, it creates a new session. The Recent Sessions list shows you who’s been using your flow lately: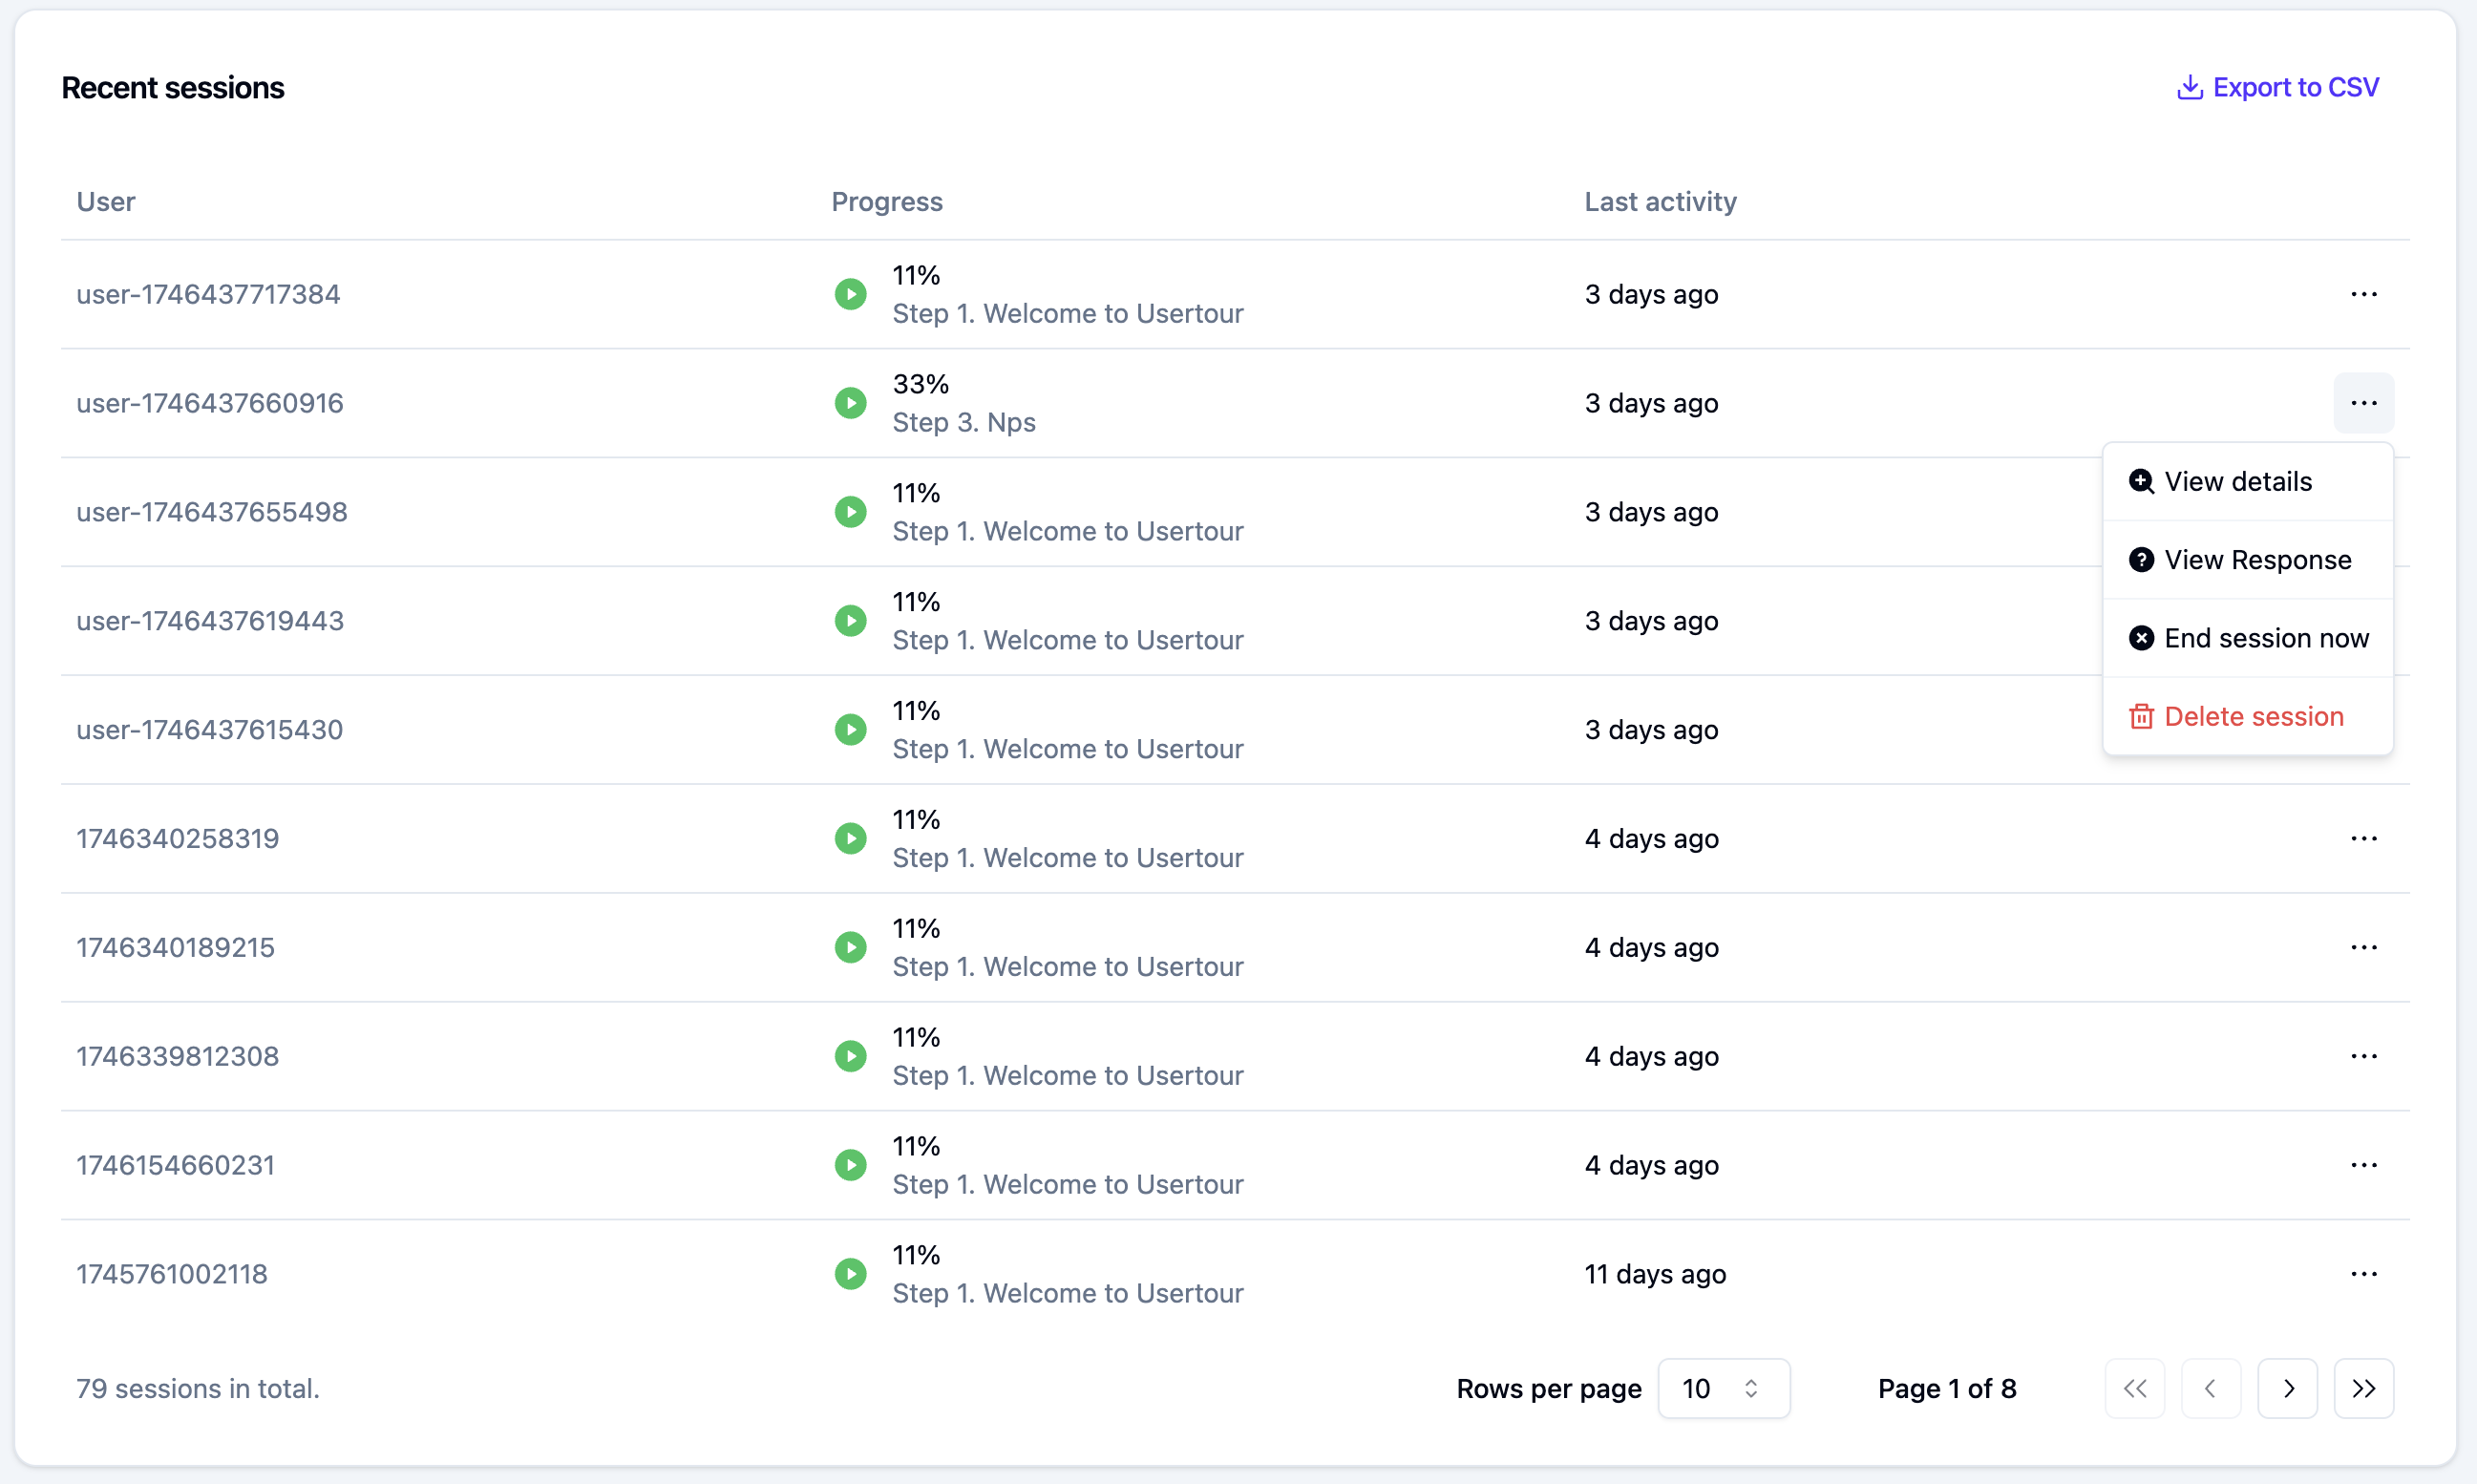
Session Details
- Click a user’s name to view their profile
- Click the horizontal dots (⋯) on the right to view detailed session information
- Track current progress
- See completion status
- Monitor current step
What You Can Learn
- Which users are engaging with your flow
- How far they’re getting
- Where they’re dropping off
- Whether they’re completing or dismissing the flow
Pro tip: Use this data to identify patterns and make informed decisions about improving your flows.